This page shows samples of
the many charts, diagrams, and illustrations that can be easily created
with RFFlow. All these charts can be used as templates for your charts.
To view a chart, click on its picture.
If you haven't done so already,
download the
trial version of RFFlow. Once it is installed, you can open any of these charts
by clicking on the .flo file name. From there you can zoom in, customize, and print your
chart.
Common Chart Types
Flowcharts
This page includes samples of basic, detailed, deployment, and opportunity
flowcharts.
Cause Mapping and Root Cause Analysis
RFFlow allows you to quickly and easily draw cause maps. You can start
with one of these samples and modify it for the problem you are solving.
Fishbone Diagrams, Cause-And-Effect Diagrams, and Ishikawa Diagrams
A cause-and-effect, fishbone, or Ishikawa diagram helps in identifying
possible causes of a problem.
Criminal Analysis Charts
Link Analysis, Telephone Toll Analysis, Activity Flowchart, Commodity
Flowchart, and Crime Scene.
Block Diagrams and Bar Charts
This page includes a block diagram, bar chart, cluster bar chart,
circle-spoke chart, checklist chart, comparison chart, connection chart,
pyramid chart, and target chart.
PERT, CPM, and WBS Charts
This page includes PERT, Critical Path Method (CPM), and Work Breakdown
Structure (WBS) charts.
Process Mapping
This includes relationship maps, cross-functional process maps, and
process flow charts.
Roads and Intersections
You can use the stencils in the
Transportation folder to draw
highway diagrams.
Tournament Charts
Use these charts to make your own tournament or use them for an office
pool.
Software Design and Modeling
RFFlow can be used to draw many different
software design diagrams, including database design, UML, Booch OOD, Express G, Gane-Sarson
Data Flow, Martin ERD, Rumbaugh OMT, Shlaer-Mellor OOA, Structure Charts,
and Yourdan Data Flow.
HTML Link Diagram
Download
HTML Link Diagram.flo
Web site structure can be diagrammed to ensure a clean and consistent Web
presentation.
System Design
System Design
Download
System Design.flo
A system design shows the components and wiring in a network of computers
and other devices. RFFlow includes a multitude of shapes for diagrams of
this type.
Bus Topology
Download
Bus Topology.flo
This system design shows a bus topology using 10BASE2 hardware.
Star Topology
Download
Star Topology.flo
This diagram shows a star topology using unshielded twisted pair 10BASE-T
Ethernet media.
Industry
Process Flow Diagrams
Sample process flow diagrams and piping and instrumentation drawings.
Circuit Diagram
Download
Electronic Circuit.flo
RFFlow makes documenting electronics a simple task.
Business
Office Layout
Download
Office Layout.flo
RFFlow includes the shapes needed to plan the interior design of office
furniture and equipment.
SDL Diagram
Download
SDL Diagram.flo
Diagrams that use the Specification and Description Language (SDL) show
protocol control for circuit-switched basic calls.
Transportation Plan
Download
Transportation Plan
RFFlow has shapes that can graphically describe plans in commerce and
transportation.
Value Stream Mapping
Download
value_stream_1.flo
Value Stream Mapping is used to analyze the flow of materials and
information currently required to bring a product or service to a
consumer.
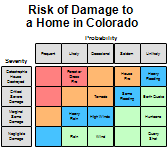
Risk Assessment Charts
Risk Assessment charts are used to identify which risks are the most important.
These charts arrange risks by probability and severity and show which are the
most likely to be a problem.
Mathematics and the Sciences
RFFlow's OLE compatibility makes it ideal for
illustrating technical and scientific documents. Illustrations printed
with RFFlow are photo-ready for publication.
Math Symbols
Download
math-symbols.flo
RFFlow allows you to draw mathematical equations.
Venn Diagram
Download
Venn Diagram.flo
Set Theory in mathematics uses Venn Diagrams like this one to depict the
proofs of theorems.
Mechanics Illustration
Download
Mechanics Illustration.flo
This physics diagram shows the flight of a projectile.
Optics Illustration
Download
Optics Illustration.flo
This diagram shows the path of two light rays refracted by the lenses of a
Galilean telescope.
Military Symbols