These diagrams can be downloaded and edited. It is often easier to modify an
existing diagram than to draw a new one.
If you don't have RFFlow installed already,
download
the free trial version. Then you can open the samples on this page
directly in RFFlow by clicking on the .flo file links below. From there you
can zoom in, edit, and print the sample chart.
Two stencils were used to create these charts:
Pert, CPM, CPA Charts
Work Breakdown Structure (WBS)
To open these stencils, click the
More Shapes

button, scroll to the name of the stencil, and click the
Add Stencil
button. The stencils are arranged in alphabetical order.

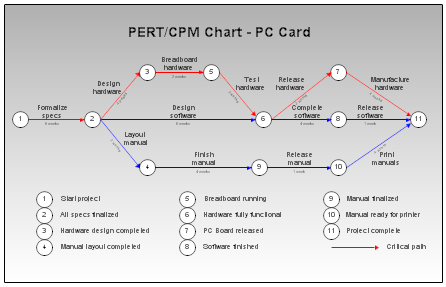
PERT stands for Program Evaluation and Review Technique. The numbered
circles represent tasks or milestones in a project. The arrows show the
sequence of these tasks. The time to do a task is shown near the arrow.
The critical path in the chart at the left is drawn with red arrows. PERT
charts display task dependencies, showing which tasks need to be done
before others can be started.

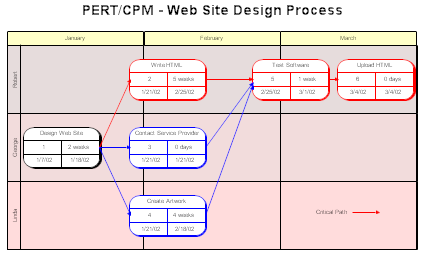
PERT charts are also called Critical Path Management (CPM) or Critical
Path Analysis (CPA) charts. The PERT chart on the left places the time to
do a task, starting date, and ending date inside the task box. The
horizontal axis has time in months and the vertical axis shows who will be
doing the work.

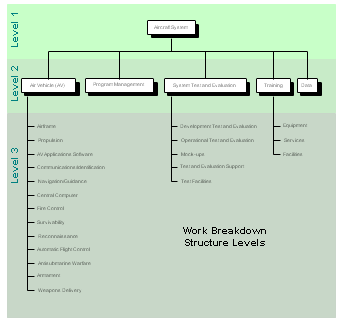
A Work Breakdown Structure (WBS) chart is a hierarchical breakdown of a
project into successive levels. Each level contains more detail.

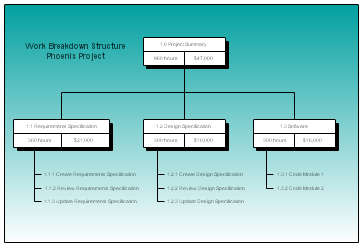
This Work Breakdown Structure (WBS) chart numbers each task for easy
identification. It also includes the hours needed to complete each task
and the total cost of the task.


