RFFlow 5 Professional Flowcharting

Professional Flowcharting Software

Home | Samples | Overview | Free Trial | Tutorial | Purchase | Upgrade | Support | Search

Block Diagrams and Bar Charts

These charts can be downloaded and edited. It is often easier to modify an existing chart than to draw a new one.

If you don't have RFFlow installed already, download the free trial version. Then you can open the samples on this page directly in RFFlow by clicking on the .flo file links below. From there you can zoom in, edit, and print the sample chart.

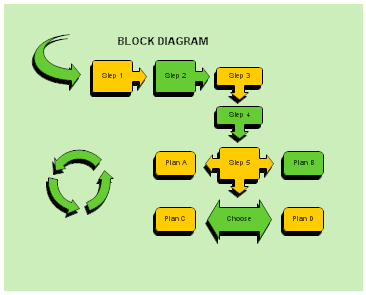
Many of the shapes used on this page are in the Block Diagrams and Arrows stencil. To open this stencil, click the More Shapes button The More Shapes Button in RFFlow, Block Diagrams and Arrows, and Add Stencil.

Block Diagram for a Library Book Sale

Click to enlarge image
Download library_booksale.flo
Block Diagram for a Library Book Sale

Block Diagram Flowchart

Click to enlarge image
Download block_diagram1.flo
Block Diagram Flowchart

Block Diagram for a Development Cycle

Click to enlarge image
Download development_cycle.flo
Block Diagram for a Development Cycle

Block Diagram of an Organization

Click to enlarge image
Download block_diagram2.flo
Block Diagram of an Organization

Pyramid Chart for Management Levels

Click to enlarge image
Download management_levels.flo
Pyramid Chart for Management Levels
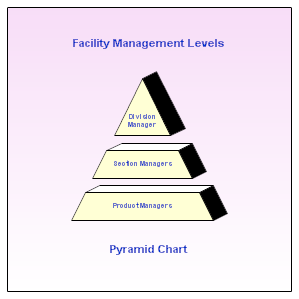
Pyramid charts are used to show hierarchical lists. You can use them to show business goals or customer requirements. The most important item is usually placed at the top of the pyramid.

Target Chart

Click to enlarge image
Download restaurant_rating.flo
A Target Chart
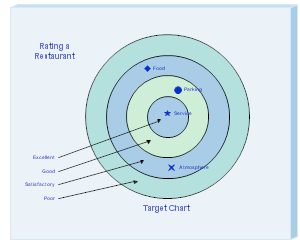
A target chart allows you to rate items by placing them in one of several concentric circles. The center is the highest position.

Circle/Spoke Chart

Click to enlarge image
Download civic_center.flo
A Circle/Spoke Chart
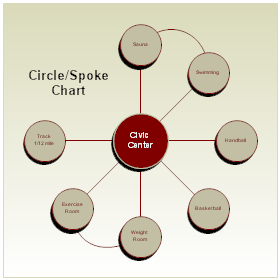
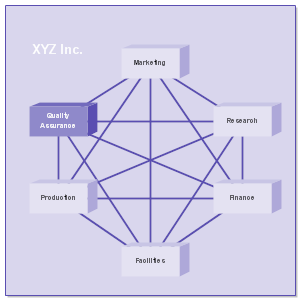
Spoke charts have a central item surrounded by other items in a circle. These charts can be used to show the features or components of the central item. Curves are drawn between related components.

Comparison Chart

Click to enlarge image
Download comparison_chart.flo
A Comparison Chart
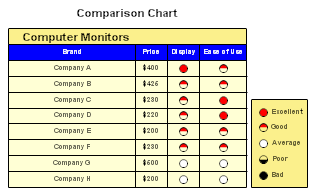
Comparison charts are used to compare products by rating their features.

Connection Chart

Click to enlarge image
Download connection_chart.flo
A Connection Chart
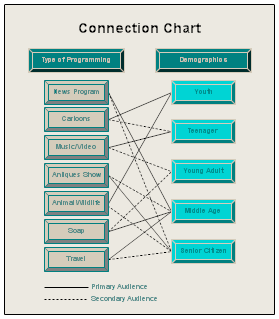
This connection chart lists different types of television programming on the left. These include news programs, cartoons, music/video programs, etc. On the right is a list of different age groups. A solid line connects the primary viewers with a program type. A dotted line connects the secondary viewers with a type of programming.

Checklist Chart

Click to enlarge image
Download checklist_chart.flo
A Checklist Chart
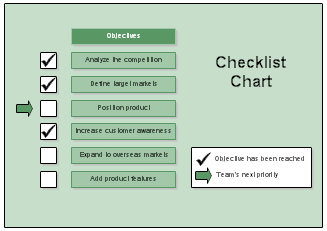
A check beside an item means that item has been completed. An arrow shows the next item to be worked on.

Bar Chart

Click to enlarge image
Download bar_chart1.flo
A Bar Chart
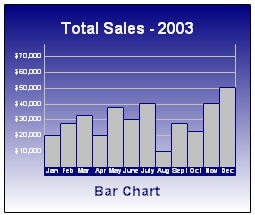
In drawing bar charts, you may want to add the Gantt stencil. It includes shapes for the months, years, and quarters which also show up on bar charts.

3-Dimensional Bar Chart

Click to enlarge image
Download bar_chart2.flo
3-Dimensional Bar Chart
This bar chart shows the total sales for three different items between 1990 and 1995.

Cluster Bar Chart

Click to enlarge image
Download cluster_bar_chart.flo
A Cluster Bar Chart
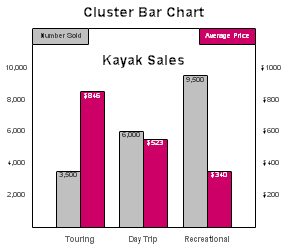
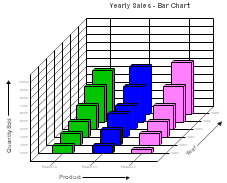
This bar chart shows the number of kayaks sold and the average price for three different types of kayaks.

Register
| Documentation | Privacy and Security | Version Information | Free Additional Shapes | Software Resellers | Free Viewer | Contact | Full Version
RFF Electronics
PO Box 1244 a gray dot Loveland CO 80539-1244 USA a gray dot Phone 970 663 5767 a gray dot www.rff.com a gray dot rff@rff.com
Copyright © 1996-2024 RFF Electronics. All rights reserved.