![]() |
![]() |
|
![]() |
||
Professional Flowcharting | ![]() |
Home | Samples | Overview | Download Trial | Tutorial | Purchase | Upgrade | Support | Search |
Gantt Charts and Project Schedules |
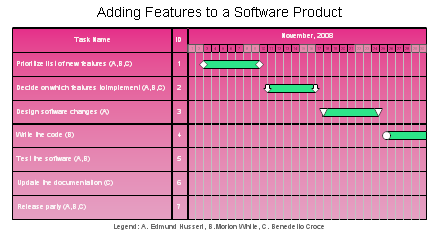
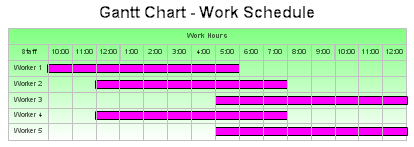
Gantt charts show task and schedule information. The tasks are usually
numbered and listed vertically. A bar shows the starting date and projected
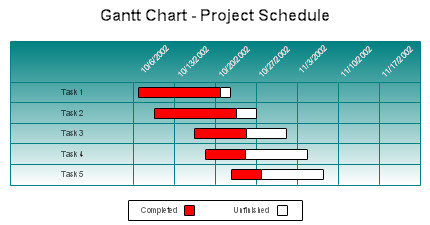
completion date of each task. Color or shading is sometimes used to show how
much of each task has been completed. A Gantt chart is a management tool and a
communications tool. These charts can be downloaded and edited. It is often easier to modify an existing chart than to draw a new one. If you haven't done so already, download the free trial version of RFFlow. Once it is installed, you can open the samples on this page directly in RFFlow by the links to the right of each picture. From there you can zoom in, edit, and print the sample chart. RFFlow can also create a Gantt chart from data. To learn more about this see How to Draw a Gantt Chart. |
Gantt Chart - Adding Software Features | ![]() |
Click
to enlarge image
Download software_features.flo See also: How to Draw a Gantt Chart. |
Gantt Chart - Project Schedule | ![]() |
Click to enlarge image
Download gantt1.flo See also: How to Draw a Gantt Chart. |
Gantt Chart - Project Schedule | ![]() |
Click to enlarge image
Download gantt2.flo |
Gantt Chart - Project Development | ![]() |
Click to
enlarge image
Download project_development.flo
|
Gantt Chart - Work Schedule | ![]() |
Click to enlarge
image
Download workschedule.flo |
See also: |
Register | Documentation | Privacy and Security | Version Information | Free Additional Shapes | Software Resellers | Free Viewer | Contact | Full Version |
RFF Electronics |
PO Box 1244 ![]() ![]() ![]() ![]() |
Copyright © 1996-2019 RFF Electronics. All rights reserved. |