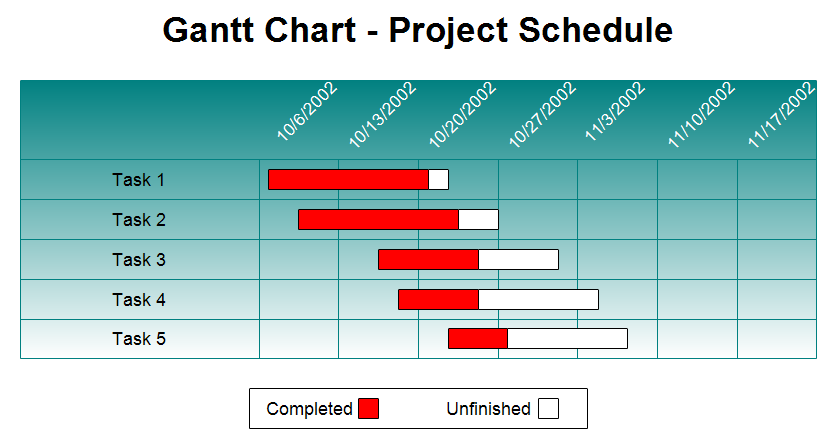
A Gantt chart or project schedule includes a list of tasks on the left and
horizontal bars on the right showing when the tasks begin and end. In this
Gantt chart, the smallest increment is one week. You can also draw charts with
one hour, day, or month being the smallest incremental value. Gantt charts
show task and schedule information. A Gantt chart is a management tool and a
communications tool. Color or shading is sometimes used to show how much of
each task has been completed. In the Gantt chart shown above the red portion
shows how much of that task is completed.
First
download the
free trial version of RFFlow. It will allow you to open any chart and make
modifications.
Once RFFlow is installed, you can open the above chart in RFFlow by clicking
on
gantt2.flo.
From there you can zoom in, edit, and print this sample Gantt chart. It is often
easier to modify an existing chart than to draw it from scratch.
To draw this chart without downloading it, run RFFlow and click on the
More
Shapes 
button. Scroll to the
Gantt Charts stencil and click it. Then
click the
Add Stencil button.
To learn how to input data and have RFFlow automatically generate a Gantt
chart,
see:
How to Draw a Gantt Chart