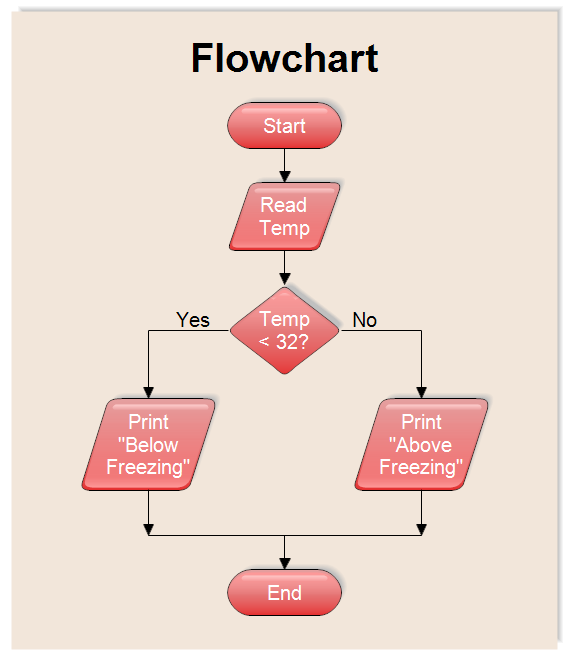
Drawing the above flowchart demonstrates the use of the input
and output shape. It is a parallelogram shape as shown below.

In the chart above, the temperature is an input. Printing the results is an
output. Some companies don't bother to to use the parallelogram shape and just
use a standard rectangle. You should find out the accepted practice for your
organization.
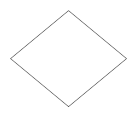
The diamond shape shown below is a decision shape. It allows you to ask a
question in a flowchart. It has one entry point at the top and can have up to
three exit points. In the above chart, the question asked is "Is the
temperature less than 32 degrees?" If the answer is yes, control flows
out to the left following the line with the word "Yes" and if the
answer is no, control flows to the right following the line with the word
"No."

First
download the free trial
version of RFFlow. It will allow you to open any chart and make modifications.
Once RFFlow is installed, you can open the above chart in RFFlow by clicking
on
flowchart_input_output.flo.
From there you can zoom in, edit, and print this sample chart. It is often
easier to modify an existing chart than to draw it from scratch.
To draw this chart without downloading it, run RFFlow and click on the
More
Shapes 
button.
Scroll to the
Flowcharting folder and click the plus sign to open it.
Click the
Colored With Reflections stencil and then click the
Add
Stencil button.


