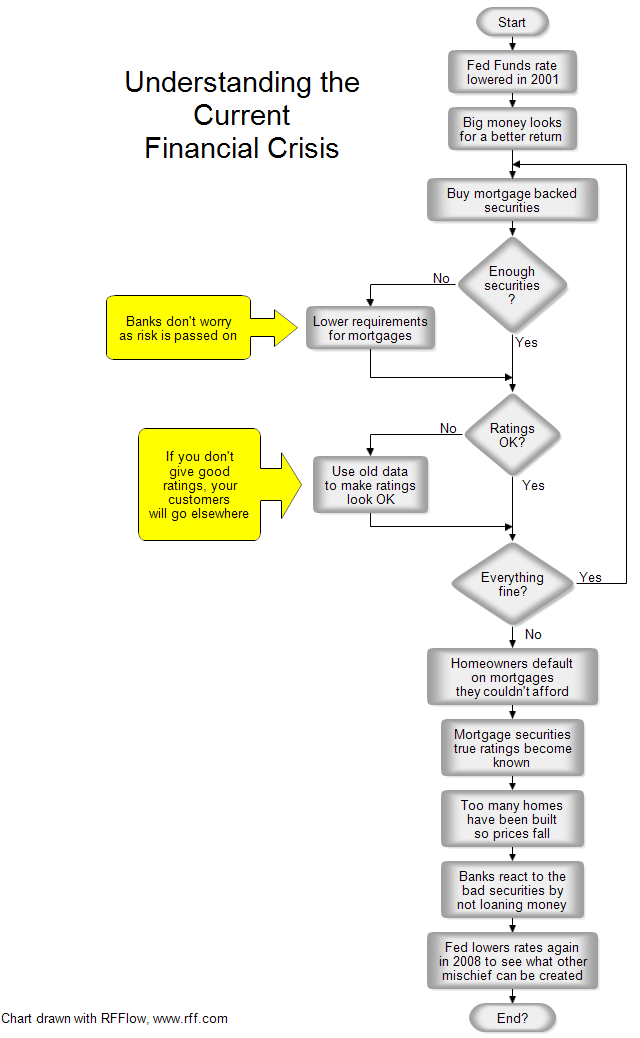
This flowchart tries to explain the basic points in the current mortgage crisis.
The story is probably an old one. People try to get the maximum return on their
money. Big returns have big risk. Investors may not have realized this, but the
risk was there. The two yellow boxes in the chart above show where regulation
failed. Normally a bank wouldn't give a loan to someone who had no income and no
assets and such mortgages combined together should not have a high rating. By
elevating these toxic mortgages to triple A an enormous amount of wealth was
generated. However, this wealth disappeared when their true value was
determined. This will all happen again, but in a different way.
If you haven't already done so, first
download the
free trial version of RFFlow. It will allow you to open any chart and make
modifications.
Once RFFlow is installed, you can open the above chart in RFFlow by clicking
on
foreclosure.flo.
From there you can zoom in, edit, and print this sample chart. It is often
easier to modify an existing chart than to draw it from scratch.
To draw this chart without downloading it, run RFFlow and use the Sample
Stencil.