This deployment flowchart shows the steps needed to bring a new product to
the marketplace. The tasks are listed in order and are placed in one of the
three columns: Research & Development, Production & QA, or Marketing.
Deployment flowcharts highlight places in a process where work moves from one
group or person to another. This is often where the problems occur.
A deployment flowchart combines two key features:
- The sequence of steps in a process
- Who is responsible for each step
The shapes used in drawing a deployment flowchart are the same as those in
a standard flowchart with a few of additions.
The assist circle is a white circle in a column. It means that assistance is
provided by that column. For example, in the chart above, Marketing assists
with step 2. If you are providing assistance, you are helping out, but not in
charge.
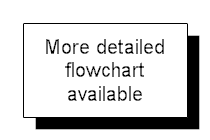
A rectangle with a shadow indicates that there exists a more detailed
flowchart for this step.
Meetings are denoted by using in a rounded box. The box would extend across
all the columns that took part in the meeting or be listed in each column.
When two lines cross, you can use a bridge to show that there is no
intersection. Usually when lines cross, the control flow continues straight
along the line so bridges are often not used.
First
download the
free trial version of RFFlow. It will allow you to open any chart and make
modifications.
Once RFFlow is installed, you can open the above chart in RFFlow by clicking
on
product_deployment_flowchart.flo.
From there you can zoom in, edit, and print this sample chart. It is often
easier to modify an existing chart than to draw it from scratch.
To draw this chart without downloading it, run RFFlow and click on the
More
Shapes 
button.
Scroll to the
Flowcharting folder and click the plus sign to open it.
Click the
Deployment (Functional) stencil and then click the
Add
Stencil button.


