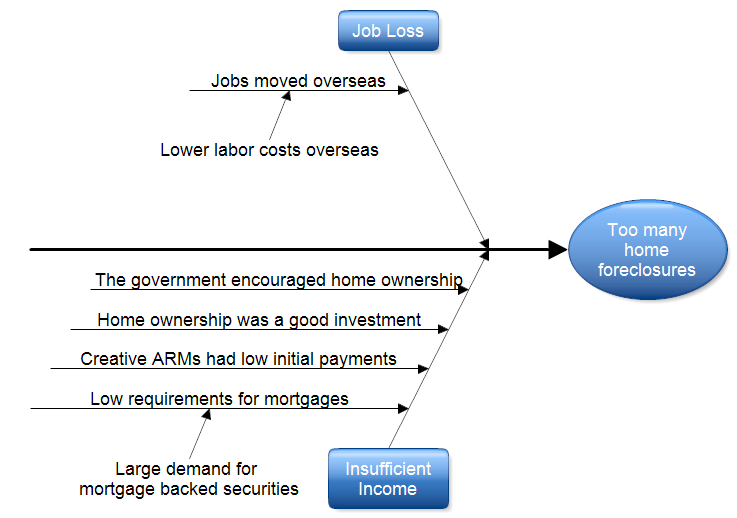
This fishbone diagram deals with the home foreclosure problem of 2008 to 2009.
The problem is placed on the right with a large arrow pointing toward it. People
foreclosed on their homes because they lost their jobs and were unable to pay
the mortgage or they got into a mortgage they never really could afford. These
two causes are placed in boxes with lines connecting them to the large backbone
arrow. Next the primary and secondary causes are listed. For example, people got
adjustable rate mortgages that had low initial payments. When the payments
increased, the home owner was unable to meet them. As long as home prices rose,
the home owner could borrow on his home to finance the mortgage. The bubble
burst when housing prices started to fall.
If you haven't already done so, first
download the
free trial version of RFFlow. It will allow you to open any fishbone
diagram or cause-and-effect diagram and make
modifications.
For instructions on how to draw a fishbone diagram, see
How
to Draw a Fishbone Diagram.
Once RFFlow is installed, you can open the above fishbone diagram in RFFlow by clicking
on
fishbone-1.flo.
From there you can change the text, move shapes around, and make your own
fishbone diagram. It is often
easier to modify an existing fishbone diagram than to draw it from scratch.
To draw this diagram without downloading it, run RFFlow and click on the More
Shapes button

. Then scroll and click on the
Cause-Effect (Fishbone) stencil and finally click the
Add Stencil button.


