- Relationship Maps show the overall view. They show the departments of an organization and how they interact with suppliers and customers.
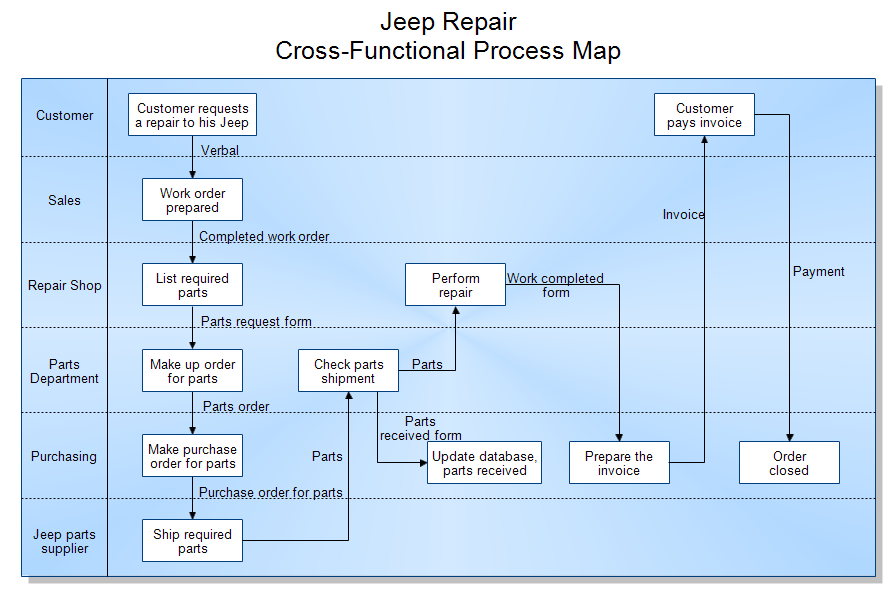
- Cross-functional Maps or Swim Lane Charts show which department performs each step and the inputs and outputs of each step. These maps have more detail than a relationship map but less than a flowchart.
- Process Flow charts or Process Flow Diagrams take a single step from a cross-functional map and expand it to show more detail. Process flow charts and process flow diagrams are the same thing.
To download and modify this cross-functional map, see the Drawing Instructions below.
The above cross-functional map shows the steps when a customer decides to have her Jeep repaired. Several departments are involved before the repair is completed and paid for. The white boxes show what each department did during that step. The lines show the inputs and outputs. These inputs and outputs may be documents, purchase orders, invoices, or physical parts.
In a cross-functional map the customer, departments and external companies are listed on the left. They are separated by dotted lines so it is easy to see which department does which step. The dotted lines look like the swim lanes in a pool and some people refer to these as swim lane charts. The steps are connected by arrows to show the order the steps are performed. The flow is generally from left to right. The lines are labeled with the input or output of each step.

