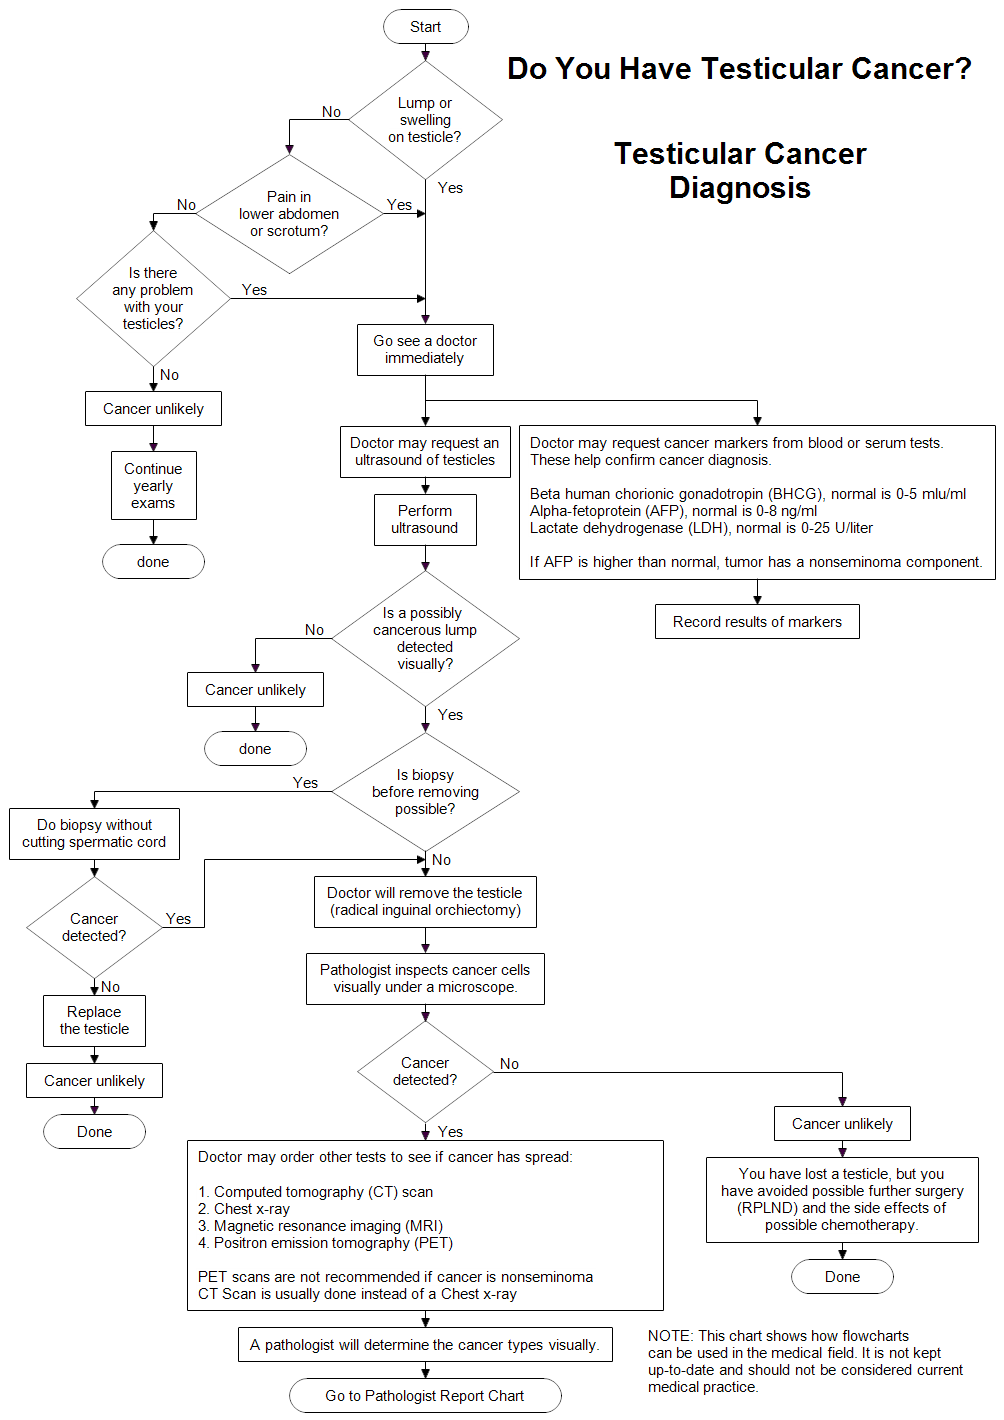
The flow chart above helps explain the steps taken in the diagnosis of testicular cancer.
Each chart should have one clear starting point. There may be several exit points. The start and finish
are shown using the terminal shape. The other two shapes used in the chart above are the decision shape for questions and
the rectangle for statements. The lines with arrows show the direction of flow through the chart. Because of the
serious nature of the subject, it is best to make the chart simple and clear, without much color.
If you haven't already done so, first
download the
free trial version of RFFlow. It will allow you to open any chart and make
modifications.
Once RFFlow is installed, you can open the above chart in RFFlow by clicking
on
testicular-cancer-diagnosis.flo.
From there you can zoom in, edit, and print this sample chart. It is often
easier to modify an existing chart than to draw it from scratch.
To draw this chart without downloading it, run RFFlow and use the Sample
Stencil.
Some helpful hints:
- We use the terminal shape to show where the chart starts and ends. This is optional but we think it is a good idea.
- To show that the chart continues on another page, draw a circle with a letter and reference that same letter on a following page.
- To insert a picture, click Insert in the main menu of RFFlow and then click "Picture from File."