If you haven't already done so, first
download the
free trial version of RFFlow. It will allow you to open any chart and make
modifications.
Once RFFlow is installed, you can open the above chart in RFFlow by clicking
on
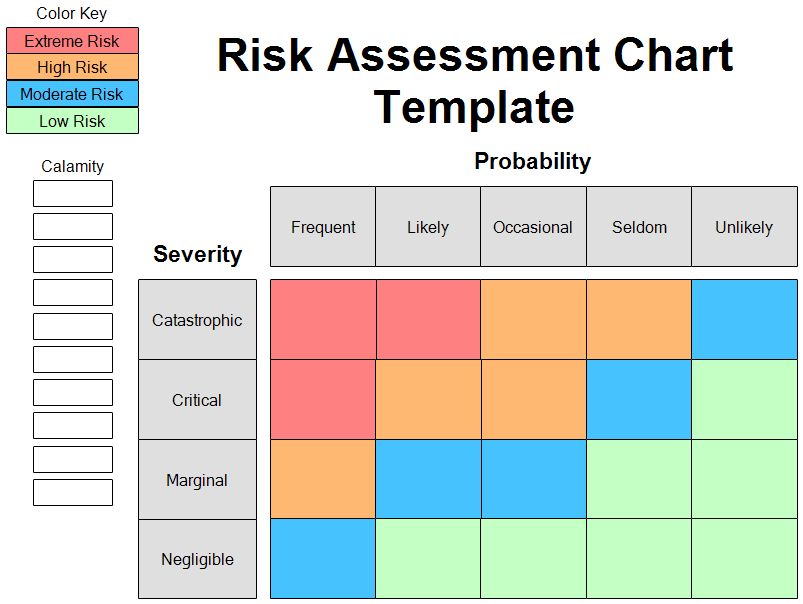
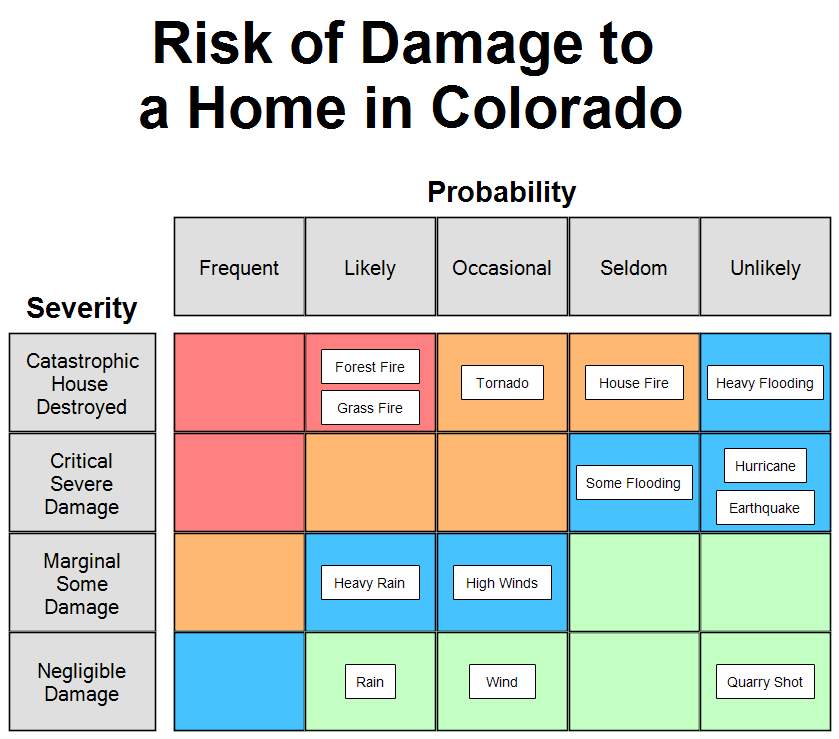
risk-to-home.flo. For your chart, you may want
to start with the template file
risk-assessment-template.flo
- The chart above was drawn to determine the main risks to a home in Colorado
where RFF Electronics is located.
- First brain-storm a list of all the things had can harm a house, like floods,
tornadoes, fire, earthquakes, etc.
- For each item in your list, think about the probability of it happening and
the severity of damage to your home. For example, an earthquake could cause
extensive damage to a home, but the probability of an earthquake in Colorado is low.
So you would write earthquake: probability is "unlikely," severity is "severe damage."
This step is the most important. Think about each calamity, how likely is it to
happen, and how much damage would it cause. Make sure you include all
possible risks, although I bet no one included a pandemic when doing a risk
assessment chart in 2019.
- Next, type earthquake into a white box and place the box in the appropriate
place on the chart. You can put multiple items in the colored boxes and make all
the boxes larger if you need to.
- When done, the boxes in the red are the ones that are the most risky. They
will cause the most problems. Next are the orange boxes, then the blue.
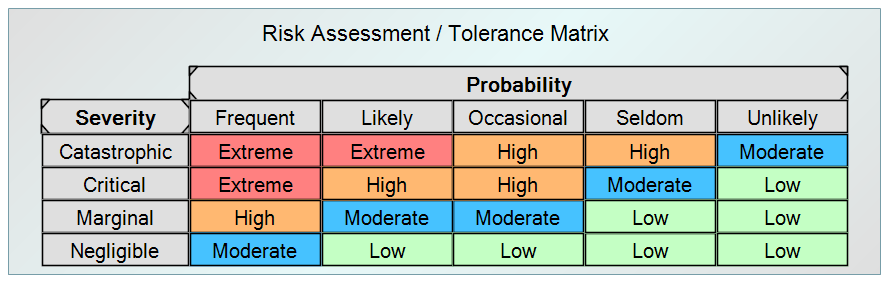
- This chart uses words for the probability and severity. You can change those
to better fit a chart for your industry.